Notes from ITU key statistical highlights: June 2012
The International Telecommunication Union (ITU) data is widely accepted as the best available and routinely serves as an international benchmark for policymakers and innovators alike. One reason is the frequency of updates: broadband and mobile numbers usually refresh every 6 months. Even though the ITU statistics are often estimates, they are still the most consistent.
New data released in June 2012 sheds light on mobile, wireless, and fixed Internet subscriptions in Africa. No real changes have been made to high-level continental subscription estimates made last November 2011 (ie. Africa still faces 0.2% fixed-broadband adoption and 3.3% mobile broadband adoption), but the ITU has noted a few additional points of interest. Plus, they’ve updated the percentage of individuals using the Internet in each country.

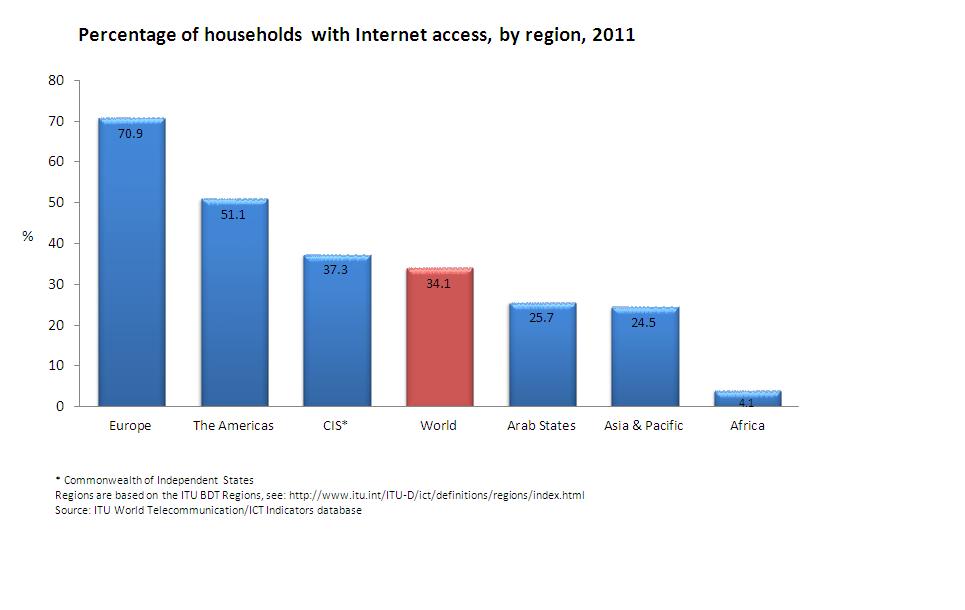
As of 2011, 4.1% of African households had Internet access. Click to enlarge. {ITU World Telecommunication/ICT Indicators database}
A summary published by ITU paints the usual picture of growth for Africa but points out how the developing world lags the global mean in terms of broadband adoption.
Mobile cellular:
- By end 2011, Botswana, Gabon, Namibia, Seychelles, and South Africa were some of the 105 nations with more mobile subscriptions than inhabitants.
- Mali is a country where mobile‐cellular penetration increased the most in 2011.
Mobile broadband:
- In Africa there are fewer than 5 mobile‐broadband subscriptions per 100 inhabitants. All other regions have penetration levels above 10%.
- Although developing countries are catching up in terms of 3G coverage, huge disparities remain between mobile‐broadband penetration in the developing (8%) and the developed world (51%).
Fixed (wired) broadband:
- Fixed‐broadband penetration remains low in Africa, at 0.2% by the end of 2011.
Internet:
- Total international Internet bandwidth increased seven‐fold over the last five years reaching 76’000 Gbit/s by end 2011. This equates to 34’000 bit/s per Internet user worldwide.
- On average, a user in Europe enjoys 25 times as much international Internet capacity as a user in Africa.
Percentage of Individuals using the Internet:
In addition to updating the continental outlook for Internet growth, an Excel spreadsheet provides country data from 2000-2011. Sources are a mix of regulatory agencies and ITU estimates. Accordingly, the numbers can vary widely from year to year. A few African nations stand out amongst the data:
Fastest African growth in adoption of Internet (2011 over 2010)
- Sudan: 138% (from 8% to 19%)
- Kenya: 100% (from 14% to 28%)
- DRC: 67% (from 0.72% to 1.20%)
- Swaziland: 64% (from 11% to 18%)
- Niger: 57% (from 0.83% to 1.30%)
High Internet adoption growth rates of 47-48% (2011 over 2010)
- Angola (down from 67% a year ago), 15% Internet usage
- Ghana (down from 76% a year ago), 14% Internet usage
- Malawi (down from 111% a year ago), 3.3% Internet usage
- Ethiopia (up from 39% a year ago), 1.1% Internet usage
Lowest African Internet adoption growth rates of 3-4% (2011 over 2010)
- Mozambique (down from 56% a year ago), 4.3% Internet usage
- Namibia (down from 78% a year ago), 12% Internet usage
- Morocco (down from 19% a year ago), 51% Internet usage
- Uganda (down from 28% a year ago), 13% Internet usage
No 2011 data:
- Mayotte, Sierra Leone, Equatorial Guinea
Again, it is hard to definitely explain the annual changes of Internet penetration rates, but many are due to government actions, international fibre, new services from existing operators, or corrections to statistical reporting.


 Twitter
 Facebook
 Pinterest