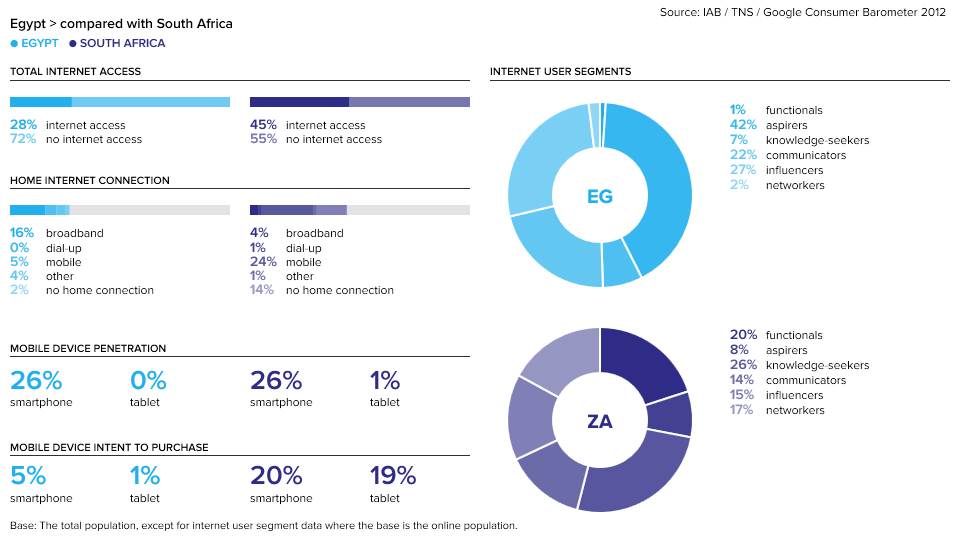
How consumers research and purchase products in Egypt and South Africa
The Consumer Barometer, made possible by Google, provides insight into how consumers use online and offline information sources in their purchase process. Not only does the resource tell the share of online purchasers by industry within a country, but the Barometer also tracks how customers research online. Marketers and businesses can use the information to stay one step ahead of the competition. We use it to see how very different the state of e-commerce is in two very different parts of Africa: Egypt and South Africa.
Both nations are considered tech-savvy in the African context, but it is clear that e-commerce has yet to realize its economic potential. For example, 12% of software purchases in Egypt are made online – the highest online share of any category. Egyptian consumers are likely to research travel purchases online, but even then, search engines are under-utilized. In South Africa, the majority of travel is now purchased online, but other goods and services are still bought offline. Still, a large share of South African consumers are likely to research a purchase online before buying offline.
South Africa:
- Of people purchasing travel, 61% bought online. The next most popular categories are media & entertainment (27%), finance/real estate (16%), and technology (9%). Only 1% of grocery or healthcare purchases were online.
- Of people purchasing travel, 90% did research online before purchasing. The next most popular categories are technology (71%), automotive (70%), and finance/real estate (69%). Retail lagged at 47%.
- 45% have Internet access
- 26% smartphone penetration
- 20% intend to purchase a smartphone
Egypt:
- Of people purchasing computer software, 12% bought online. The next most popular sub-categories are sports equipment (8%), video games (4%), and business travel (4%). On a broad category level, fewer than 2% of purchasers actually purchased online for any category of good or service.
- Of people purchasing business travel, 65% did research online before purchasing. The next most popular categories are video games (48%), package holidays (47%), and hotel stays (40%).
- Of people purchasing technology, 22% used a search engine to research online before purchasing. The next most popular categories are finance/real estate (20%), travel (16%), and entertainment (16%).
- 28% have Internet access
- 26% smartphone penetration
- 5% intend to purchase a smartphone


 Twitter
 Facebook
 Pinterest