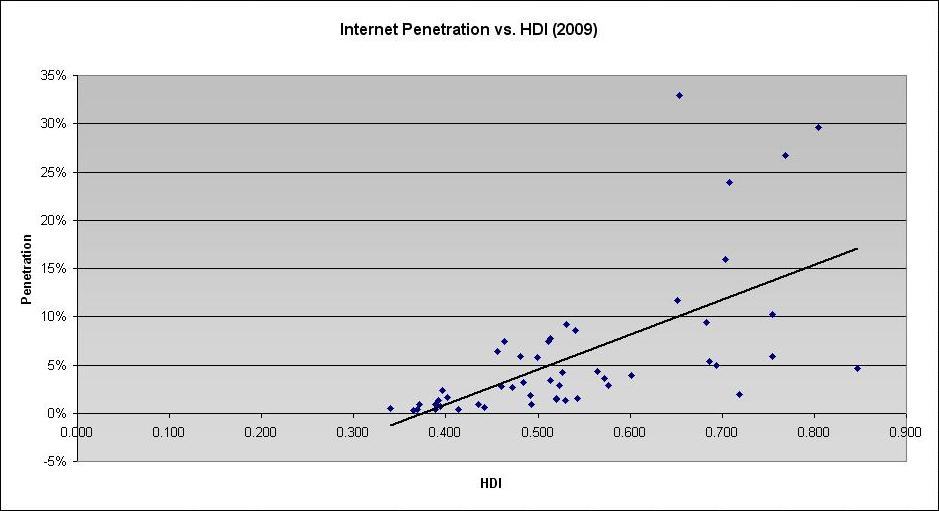
Chart : Internet Penetration vs. Human Development Index, 2009

Click to enlarge. Data source: Internet World Stats - www.internetworldstats.com and Human Development Report 2009 - http://hdr.undp.org/en/media/HDR_2009_EN_Summary.pdf
A direct correlation exists between HDI and the percentage of Internet users in African countries. The higher the HDI, the greater proportion of the population using the Internet.
| HDI Range | # African | % of African Countries | % Range Is African |
| Very High (HDI > 0.900) | 0 | 0% | 0% |
| High (0.900 > HDI > 0.800) | 2 | 4% | 4% |
| Medium (0.800 > HDI > 0.500) | 26 | 52% | 35% |
| Low (HDI < 0.500) | 22 | 44% | 92% |
| SUMMARY: Human Development Report 2009. Rep. United Nations, 2009. Web. 5 Oct. 2009. <http://hdr.undp.org/en/media/HDR_2009_EN_Summary.pdf>. |
Source: SUMMARY: Human Development Report 2009. Rep. United Nations, 2009. <http://hdr.undp.org/en/media/HDR_2009_EN_Summary.pdf>.
The above table shows that nearly all African nations are the Medium or Low HDI ranges, as designated by the United Nations Development Project. Essentially the entire low range (HDI < 0.500) is comprised of African countries. According to the graph’s best-fit line, African countries in with Low Human Development Indices should have fewer than 5% of the population on the Internet. Similarly, countries with a Medium HDI should be 5-15% connected. The data supports this hypothesis. However, even the top-ranking African nations (falling within the upper half of the HDI list) only have penetration rates near the worldwide average of 25%.
See an in-depth table of Human Development Index vs. Internet Penetration Rate here.


 Twitter
 Facebook
 Pinterest