SSA broadband facts from ‘MIS 2014’ report only marginally improved this year
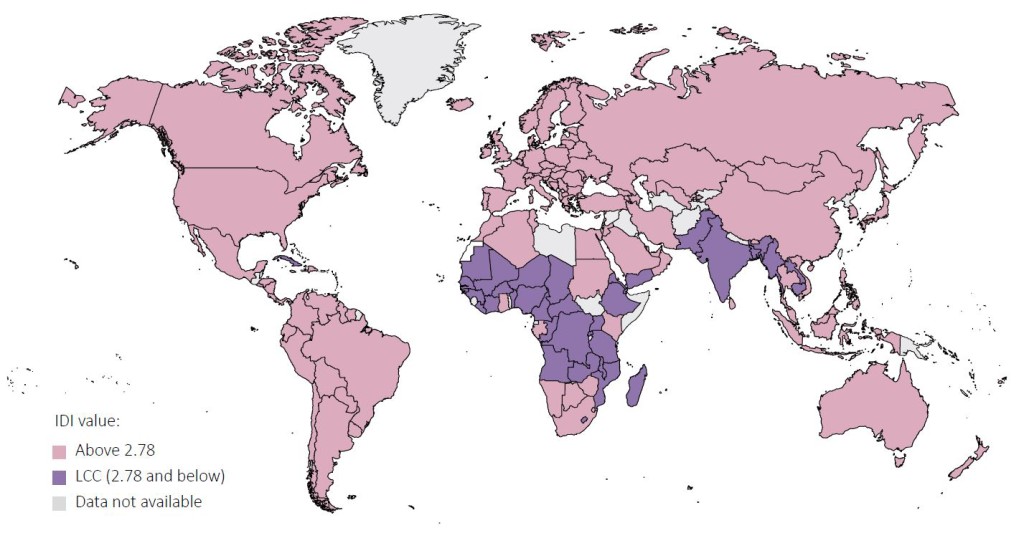
The International Telecommunications Union (ITU), regarded as a prime source for Internet statistics, has again released an annual report on Internet usage habits in 166 countries around the world (up from 157 last year). Similar to previous years, Measuring the Information Society 2014 serves to gauge how developed and developing nations compare in terms of overall information communication technology adoption. Of interest to many is the ICT Development Index which ranks nations by number of subscriptions, type of subscription, broadband availability, and cost of access. This ranking only goes so far, however, and the value of comparing African ICT benchmarks with global stats is marginal since nearly all African nations lag developed counterparts in terms of ICT access, ICT use, and ICT prices.
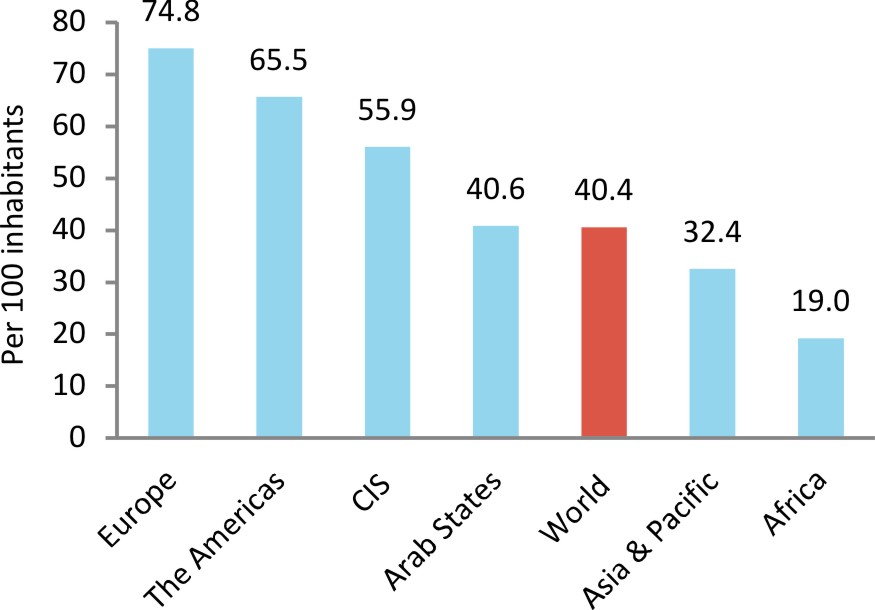
At a global level, the report finds that nearly 300 million additional people came online in 2013. By the end of last year, 32% of the world was estimated to utilize a mobile broadband subscription. Moreover, developing countries’ share of international bandwidth now stands at 30% – up from only 9% in 2004.
Still, over 4 billion people are not online – most live in the developing world. Fixed broadband penetration is still in the single digits in these countries and mobile broadband penetration is scarcely at 20%. Costs are still prohibitive though fixed-broadband prices could be reduced by 10 per cent and mobile-cellular prices by 5 per cent if competition and/or the regulatory framework improved. Still, it will take more than that to get more people only, especially when fixed broadband often costs 5% of gross national income (and is 6x less affordable in developing countries than those that are developed). A growing rural-urban divide poses a challenge as it takes more effort to get rural areas connected.
Also, the report notes that ITU is looking at ways of using newer data sources to provide more timely evidence for policy-making.
Below are some of the granular findings from the full report that best describe how African nations stack up globally in terms of ICT development, how unaffordable broadband is in Africa, who is more likely to use the internet, and which nations are experiencing the greatest improvements in ease of access.
- Mobile voice penetration has exceeded 100% in 10 of 38 surveyed African nations, suggesting there still is great room for growth
- Voice penetration levels are below 30% in Eritrea (6%), Ethiopia, and CAR
- Guinea saw a mobile-cellular penetration rate grow from 49% in 2012 to 63% in 2013 – Mozambique and the Republic of the Congo saw double-digit gains as well
- Africa stands out with a mobile broadband growth rate of over 40% in 2014
- Africa had 150 million internet users by end 2013 (17% of the population)
- Seychelles led with 50%, South Africa 49%, Mauritius (39%), Kenya (39%), Cape Verde (38%), Nigeria (38%)
- By end 2014, mobile-broadband penetration in Africa will have climbed to almost 20 per cent, up from less than 2 per cent four years earlier
- Mobile broadband penetration reached 37% in Nigeria at the end of 2013 (29% in South Africa)
- Africa has less than a 1% share of global international bandwidth
- CAR, Republic of the Congo, Chad, and Nigeria have less than 1Mbps of international bandwidth per Internet user (compared with 50Mbps for Kenya and 24Mbps for Seychelles and Mauritius)
- 4 of 38 countries have a household internet access rate of over 30% suggesting just how mobile the internet use is
- Africa’s E-Government Development Index has remained flat since 2005
- African domain name registrations accounted for less than 1 percent of global registrations
- Africa is the region with the lowest index value, and 29 out of 38 African countries are considered to be least connected countries
- Other regions are developing information societies faster than Africa
- The lack of international internet bandwidth is hampering ICT development above all
- Only Mauritius and Seychelles are above the global average value
- South Africa, Cape Verde, and Botswana round out the top African nations (all are in the top 105 globally)
- The bottom ten countries in the report are African (Central African Republic is at the bottom of the rankings)
- Cape Verde improved 11 places overall though the next best gains were from Mali and Burkina Faso (4 places)
- Botswana‘s rank fell by 4 places to 104
- Most nations were within 3 ranks of last year’s report
- Cape Verde and The Gambia saw the second greatest improvements in access ranking (improved by 7 places)
- Burkina Faso saw the third greatest improvement in use ranking (improved by 13 places), followed closely by Cape Verde and Congo (Rep.)
- In almost half of the African countries for which price data are available, mobile-broadband services were more than USD 10 cheaper per month than entry-level fixed-broadband services
- In South Africa, fixed broadband is 25 times more affordable for the richest 20 per cent of the population than for the poorest 20 per cent (African average appears to be around 10x)
- Fixed broadband prices are more than 100% of household consumption expenditure in Madagascar, Malawi, Central African Republic, and Rwanda (even for the wealthiest 20% in CAR and Rwanda)
- In Africa, handset-based mobile-broadband prices are affordable (i.e. represent less than 5 per cent of household expenditure) for less than 40 per cent of the population in every country for which data are available
- 3G penetration reached 9% in Burkina Faso after launching in 2013
- Botswana has a 74% geographic 3G penetration rate
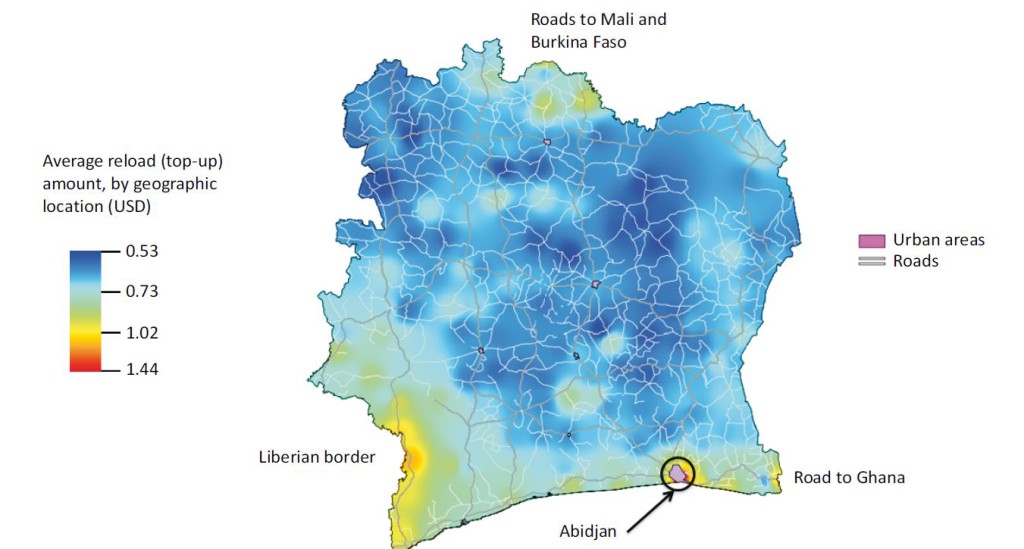
- In Cote d’Ivoire, researchers used Orange network data to understand socioeconomic segregation (poorer areas in blue)
- Similar usage of big data can reveal new insights into the digital divide and lead to new indicators but it cannot replace official statistics


 Twitter
 Facebook
 Pinterest