Operational African international bandwidth reached nearly 1.5 Tbps in December 2012
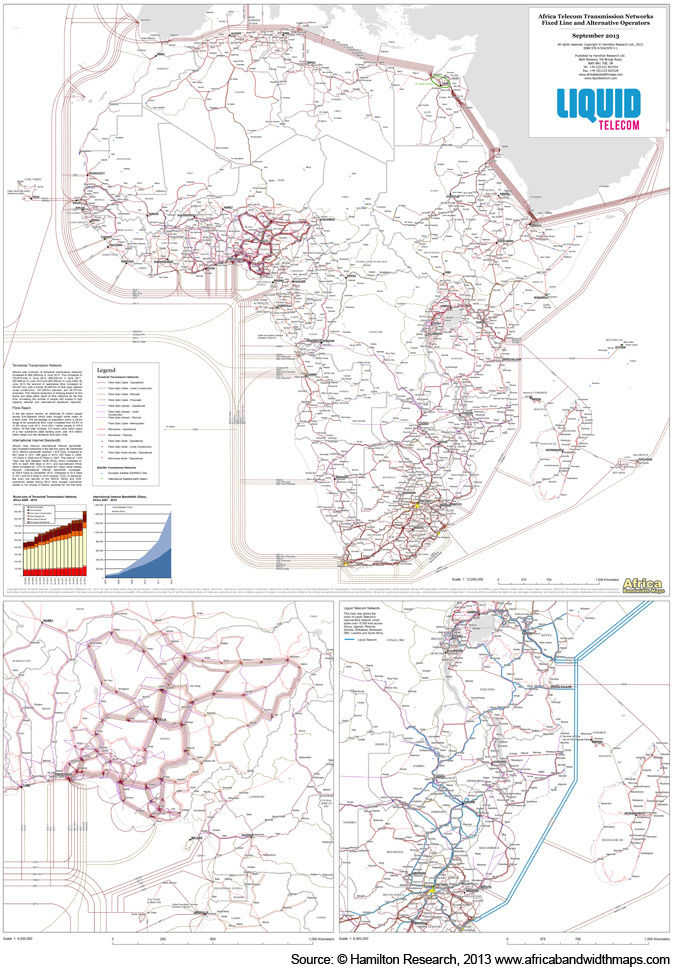
Hamilton Research, based in the UK, annually releases a map of Africa’s ever-expanding telecommunications networks. The 2013/2014 Africa Telecom Transmission Map, sponsored by Liquid Telecom, shows in great detail nearly all submarine cables, landing stations, and national fibre backbones that service Africa.
It is clear from the freely available version that coastal and urban areas have the highest density of fibre networks. Few connect North African with Sub-Saharan Africa or West Africa with East Africa. Bandwidth is less obvious from this view, but a brief synopsis gives plenty of promising information:
- Bandwidth increased by 84% year-over-year to reach 1.479 Tbps in 2012
- Bandwidth tripled between 2010-2012 and grew fifteen-fold since 2008
- Sub-Saharan African networks saw the most growth (127%) with North Africa increasing bandwidth by 50%
- Geographically, North African capacity (658 Gbps) is much greater than SSA’s capacity (821 Gbps)
- 16 submarine cables serving SSA have the capability of providing 25.8 Tbps
- Kenya used 328 Gbps in December 2012
- The increase of cross-border terrestrial network bandwidth was 4x in the past year
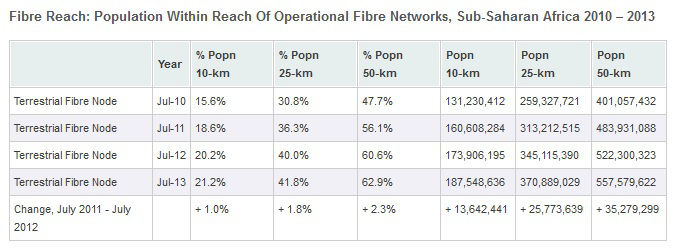
- An additional 25 million people across SSA were brought within 25km of a fibre node in 2012 (6.5 million submarine landing point, 18.5 million terrestrial node)
- 371 million people in SSA are within 25km of an operational fibre network and 187.5 million are within 10km


 Twitter
 Facebook
 Pinterest